Bioelectric Signal Project
Amplifier/Filter board
Last year I heard a radio interview on National Public Radio about a device that people were building to “enhance cognitive ability,” called a transcranial direct current stimulation, or TDCS device. The claim was that this device could enhance cognitive ability, such as increase memory retention, concentration levels, and problem solving ability, and even enhance your mood. It accomplished this by applying a low-level DC current across your head for up to 20 minutes at a time.
It turns out that this is not the flaky idea it appears to be. It has been studied for decades by psychologists, and even the US military performed a study in the 1960s with interesting results. So I decided to test this out myself. It turns out that you can build one of these devices with a few parts commonly found at electronics stores. So I built one.
My tDCS device: It works!
I tested it a few times and did notice something, though it is difficult to describe. It could have been a placebo effect, but it is easy to imagine that this current is causing some sort of reaction in the brain given one of the brain’s essential characteristics is easily measureable electrical activity.
So I thought as my next experiment, it would be interesting to measure these brain signals for myself. This is commonly done using an electroencephalography machine, or EEG. Basically, this is an instrument that measures the minute electrical signals detectable from the surface of the skull. EEG machines have been around for nearly a century, used almost exclusively for medical or research purposes. That usually means they are expensive. So the first thing a do-it-yourselfer (DIYer) does is check the open source community.
The open source movement always eliminates the cost barrier, so I searched for an open source EEG. Voila, up pops OpenEEG.org. They had published the design of a DIY EEG machine, but it was somewhat obsolete having been originally designed almost a decade ago. However, it did contain good information, especially about how to build the “front-end,” the electronics that detect and amplify the brainwave signal.
The OpenEEG design had one big disadvantage. It required the subject to be physically attached to a personal computer, something that limits its use to wherever you can set down and plug in a computer. You couldn’t, for example, measure the brainwaves of someone climbing a cliff face. That was the limit of DIY technology a decade ago.
Things have changed.
Today we can build a tiny EEG machine that could be worn in a headband, eyeglasses or some small, unobtrusive wearable item. And it need not be physically connected to a computer at all. A smartphone or tablet application could display data collected by the EEG device, either in real-time or downloaded after the fact. And it would not be that difficult to build given the low-cost prototyping tools and devices available today.
So I decided to build a prototype wearable EEG device, pulling together information from various open source sites including OpenEEG. After several months I had a working prototype that could display brain waves. And interestingly, it can detect and display other bioelectric signals. I can measure the waves produced by my heartbeat. I can see the signals that control muscles. As a matter of fact, when hooked up as an EEG, the device displays jaw muscle movement, and even the movement of my eyes.
What I built is a prototype of what could be a small, low-cost, wearable EEG. Imagine the possibilities if it became a popular product where the bio signals of tens of thousands, or even millions, of people could be analyzed. The signals produced by muscle activity are relatively well understood when compared to EEG signals. EEGs are used as medical devices but in extremely limited ways such as determining where seizure activity originates in the brain.
Though we can measure and categorize EEG signals, the fact is that medical research has provided scant information as to what those signals mean. Now imagine that medical research had access to tens of thousands of EEG signals of people doing a wide variety of activity.
What could be mined from such a database? The possibilities are amazing. Could it help individuals improve memory, thinking, or concentration? Enhance emotional well-being? Help with psychological abnormalities or mental illness? Improve early detection of brain abnormalities or tumors? Who knows what could be discovered.
So back to the prototype, the idea is this: Build a prototype wearable EEG device that can communicate wirelessly with a smartphone or tablet. An application on the smartphone or tablet would display the data in various forms, such as a real-time wave, or a processed signal that is easily interpreted by a user. This data could then be collected by the application, associated with an activity and other bio data and uploaded to the cloud. Anonymized data could be entered into a greater database.
What the prototype needs is a front-end circuit to get the signal. EEG signals are tiny, so the signal needs to be amplified and filtered to be of use. The signal then must be digitized and possibly stored. It then must be radio transmitted to a computer for further processing and display. If this computer is a smartphone or tablet computer, an application can be written that not only displays the data but also updates a cloud database.
This writeup will not go into every detail of the EEG machine I built, but I will discuss each of the major components for my prototype. They are:
An amplifier/filter front-end circuit
An Arduino Uno
A Bluetooth Low Energy (BLE) board
An Android tablet
Not mentioned in the list are the tools necessary to build and test the device. Also, it should be noted that this is a challenging project, especially if you build the amplifer/filter board from discrete components as I did.
Amplifier/Filter Front End: The bioelectric signals we want to detect are in the microvolt range, that is, one thousandth of a volt. Pretty weak. We need to amplify this to the single volt range to be usable. Also, these waves are very low frequency, basically 60 hertz and less. We don’t care about any signals greater than 60Hz.
One thing we have to consider is that all electronic circuits “pick up” electrical noise from the surrounding environment. This noise may be very small, but so is the signal we are trying to see. Therefore, we must take measures to shield our circuit to minimize spurious noise. Because shielding is not perfect, we will also need other measures to get ride of noise, namely an electronic filter. A big source of noise is power lines, all of which run at 60 hertz in the U.S. But remember, we only care about zero to 60 hertz, so we can design a simple filter that suppresses all signals greater than, and including, 60 hertz.
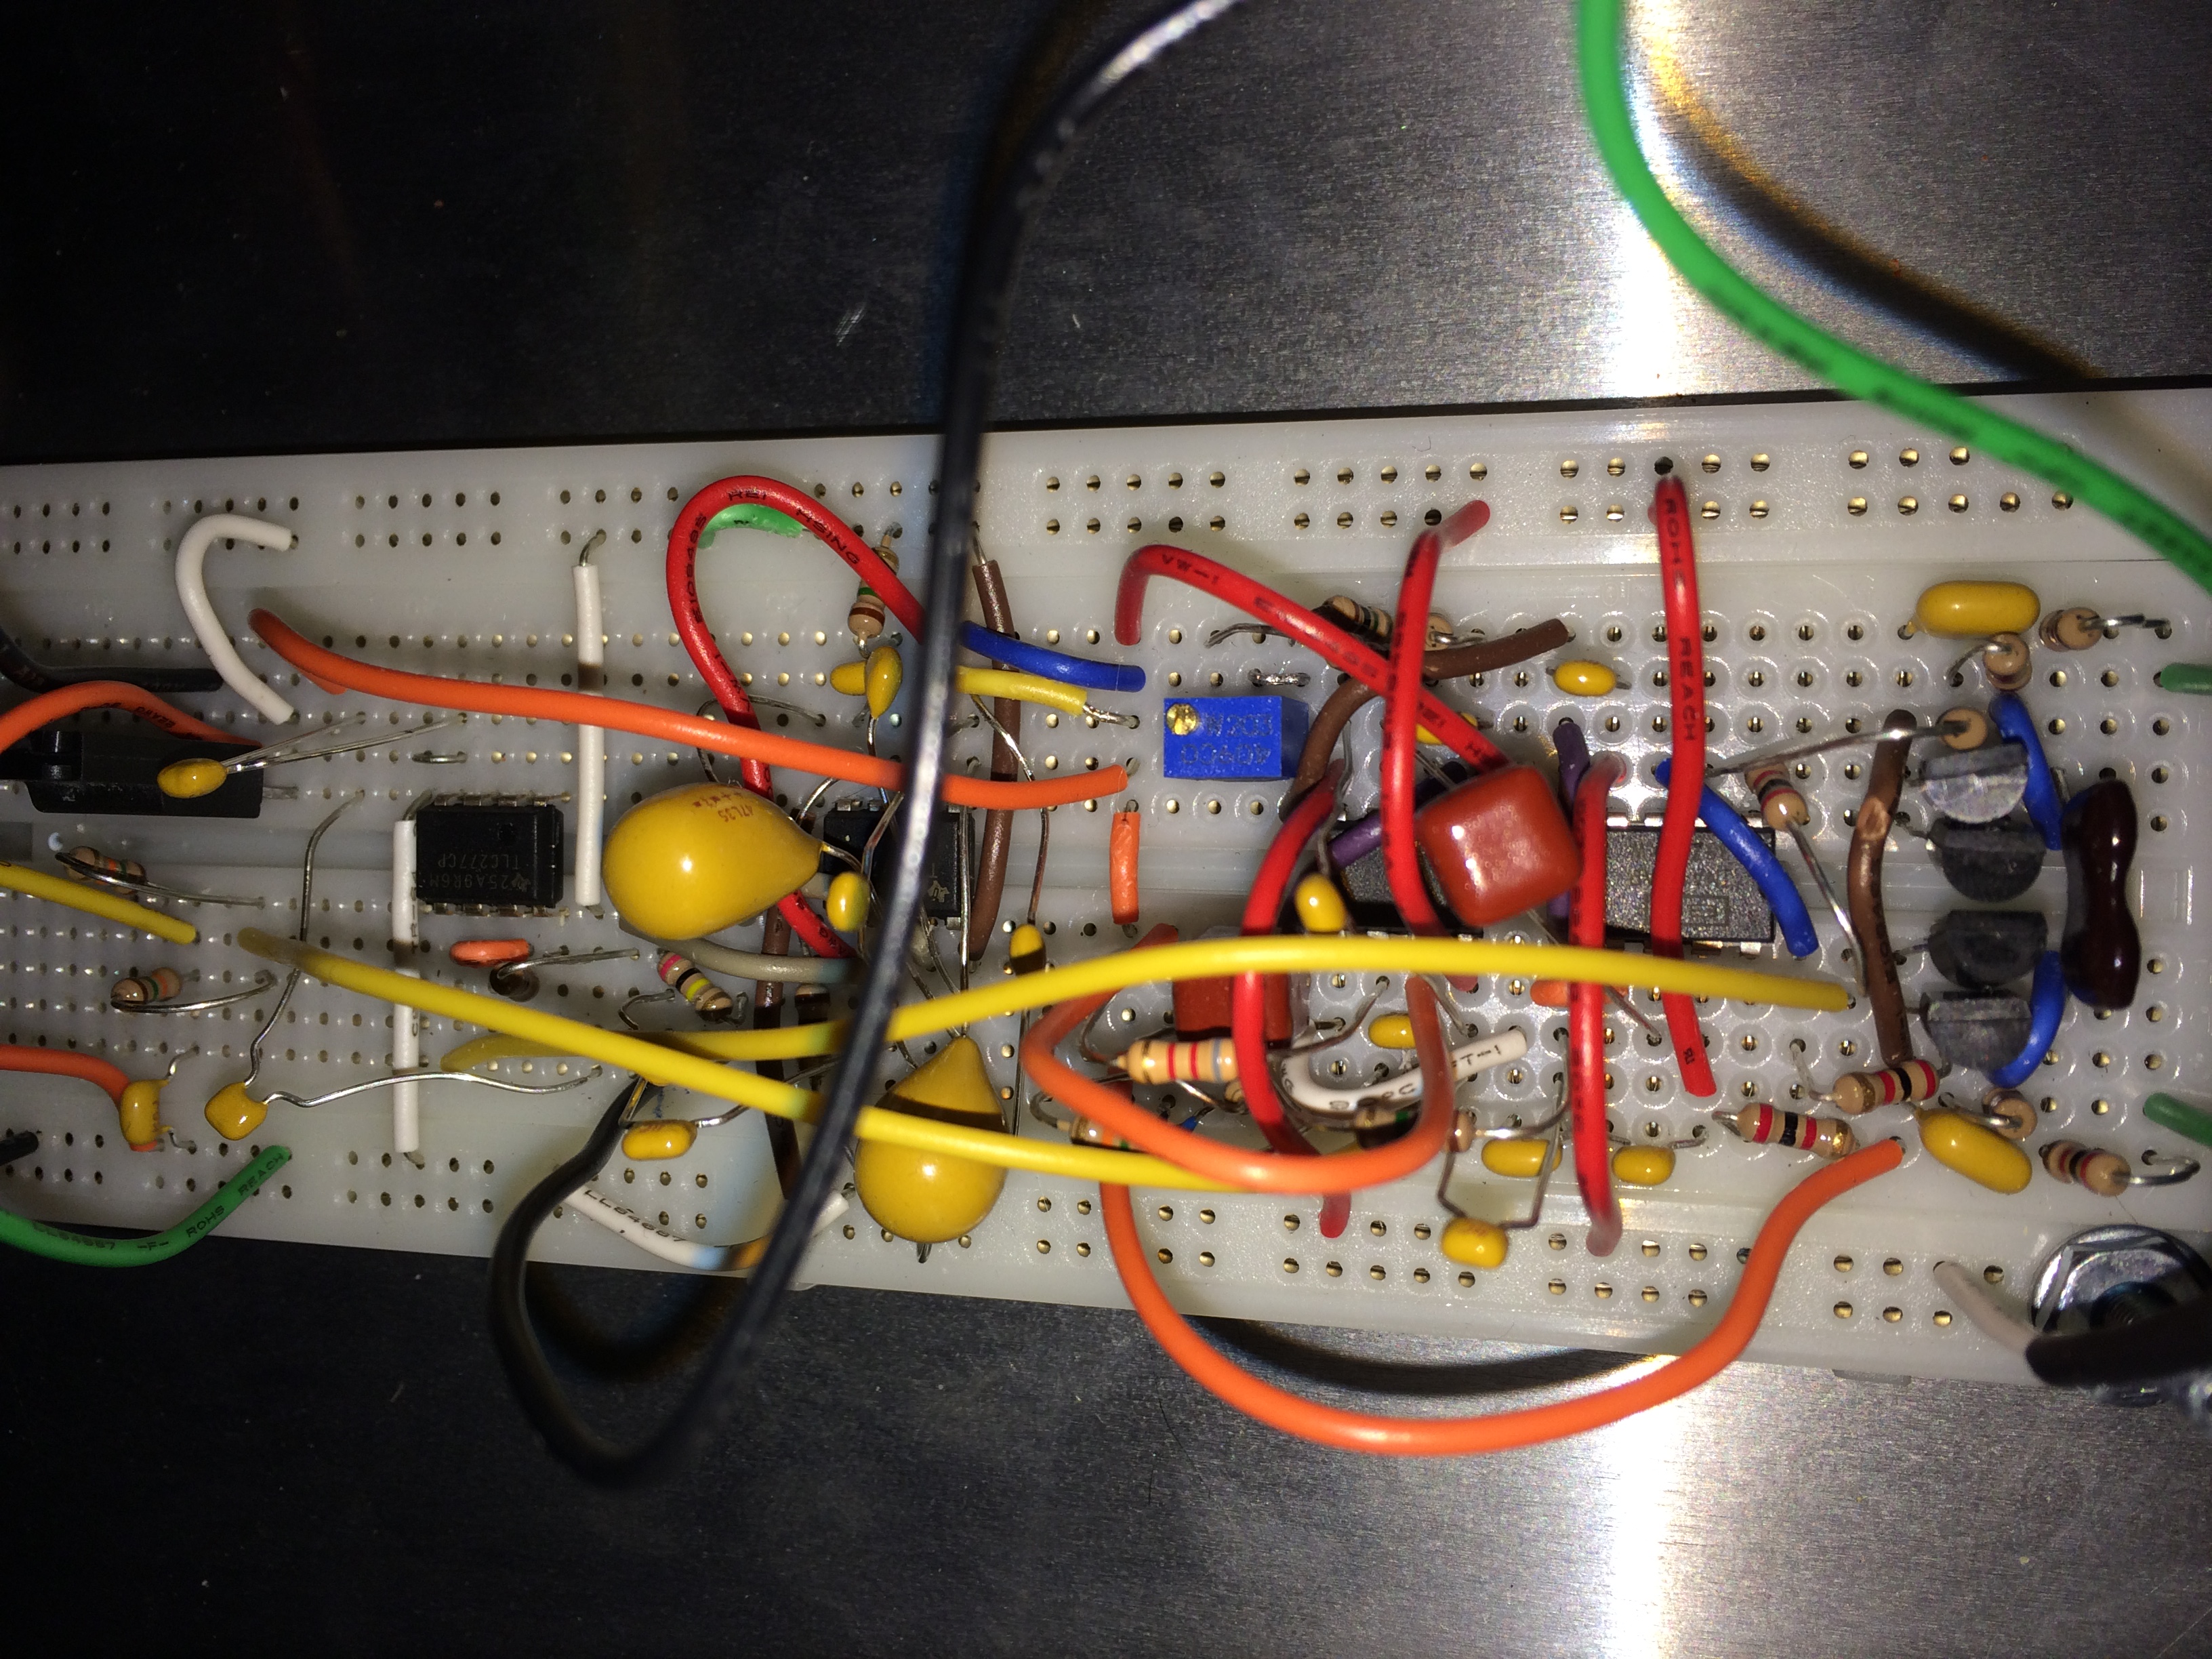
Our circuit is a three-stage amplifier that can amplify up to 10,000 times and filters signals greater than 59 hertz. It also biases the signal positive for digital conversion. I adapted this circuit from OpenEEG.org (which adapted it from a scientific research paper), along with a screen cap of an unfinished board layout made with Eagle CAD (computer aided design) software.
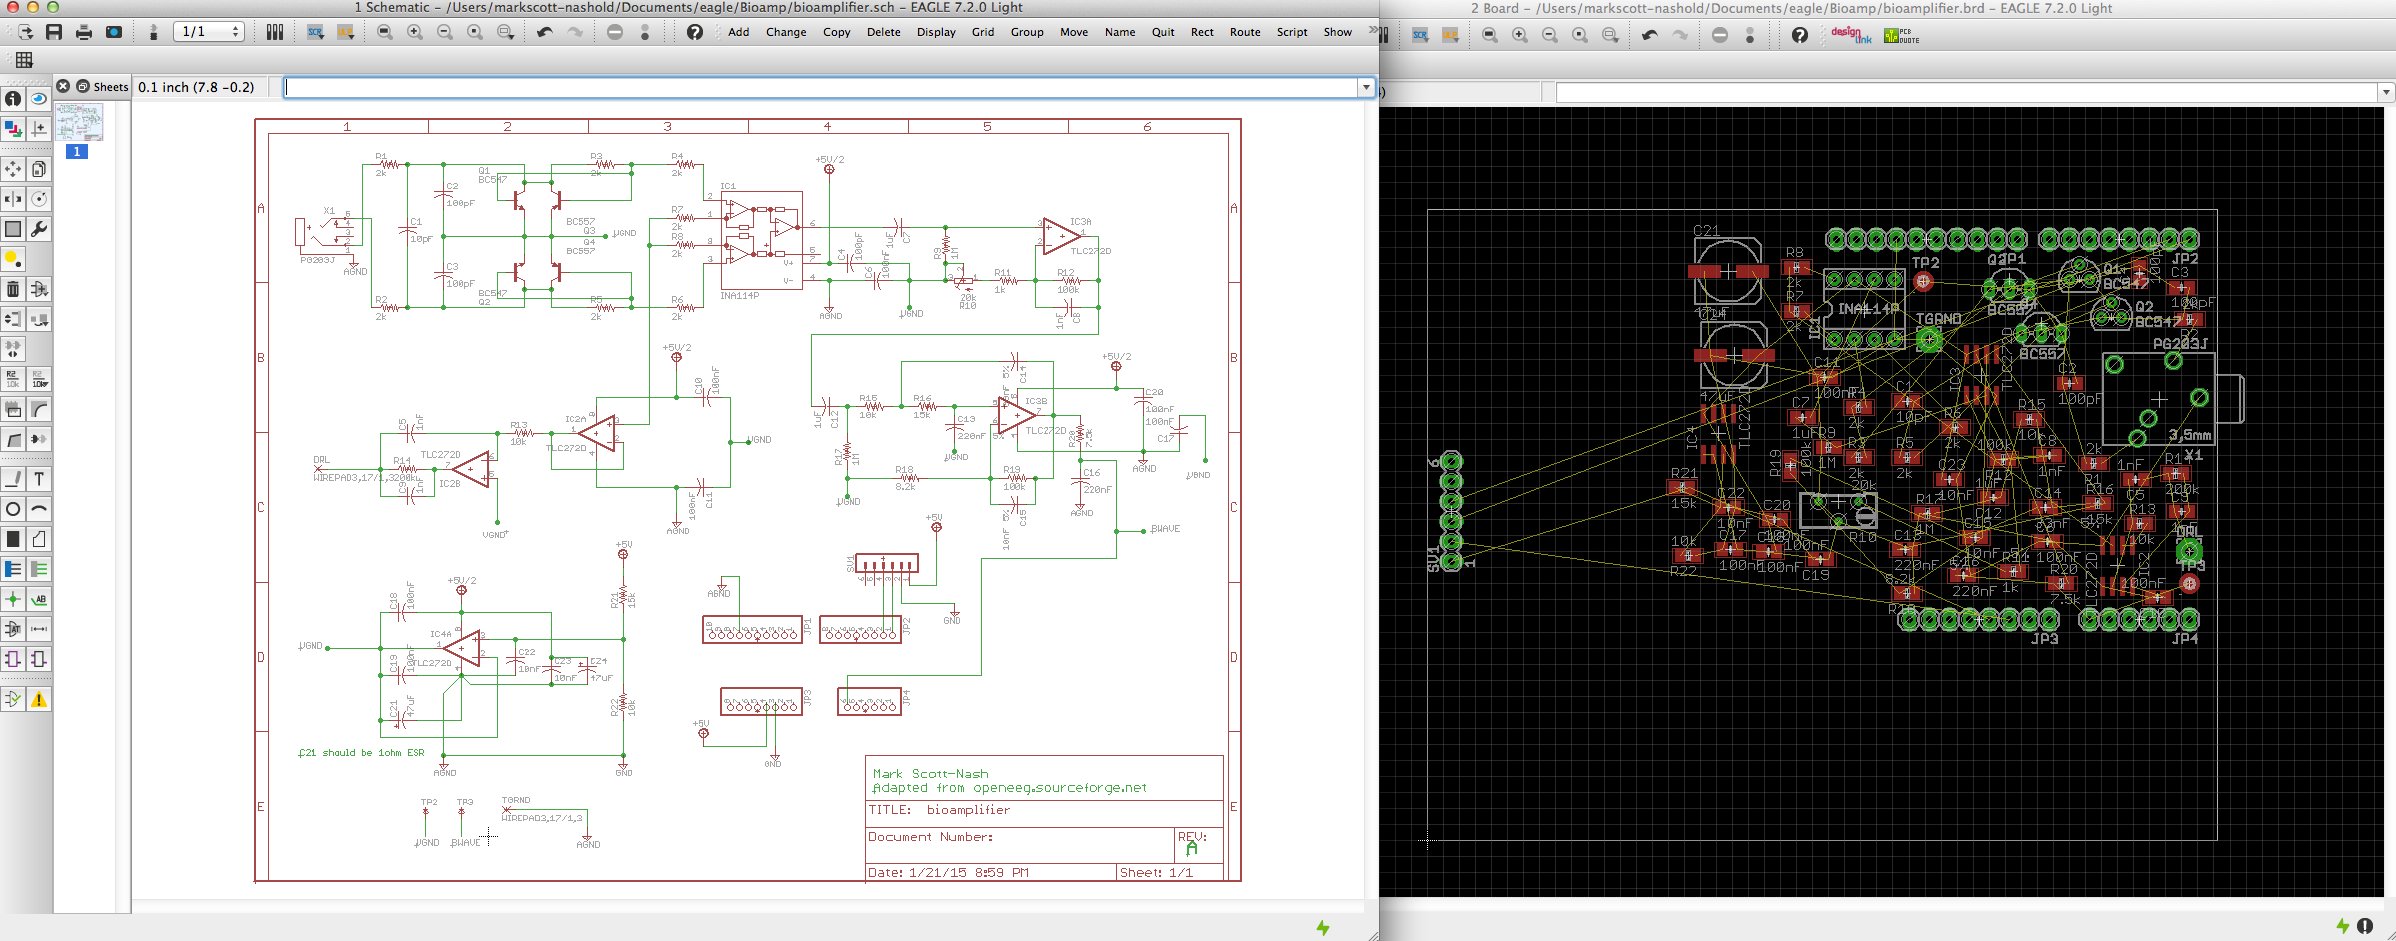
Schematic and board layout (unfinished) using Eagle
I built this circuit from discrete components on a prototype board, shown at the top of this blog post. This is not recommended unless you have advanced circuit debugging skills and tools, or know someone who does. The reason is because there are more than 50 individual components with more than 100 connections between them. It is essentially impossible to build this circuit by hand without making a mistake, and likely several, that will render it inoperable and turn this into an exercise in extreme frustration.
To shield this circuit, I put it in a metal project box. The input to this box is a fully shielded, two-channel audio cable that can be plugged into the probes. The output of the box is an analog signal that is fed into an Arduino, see below.
Arduino Uno Board: This board was chosen to provide and quick and dirty prototyping platform to digitize the analog signal and parse it for transmission, pictured below.
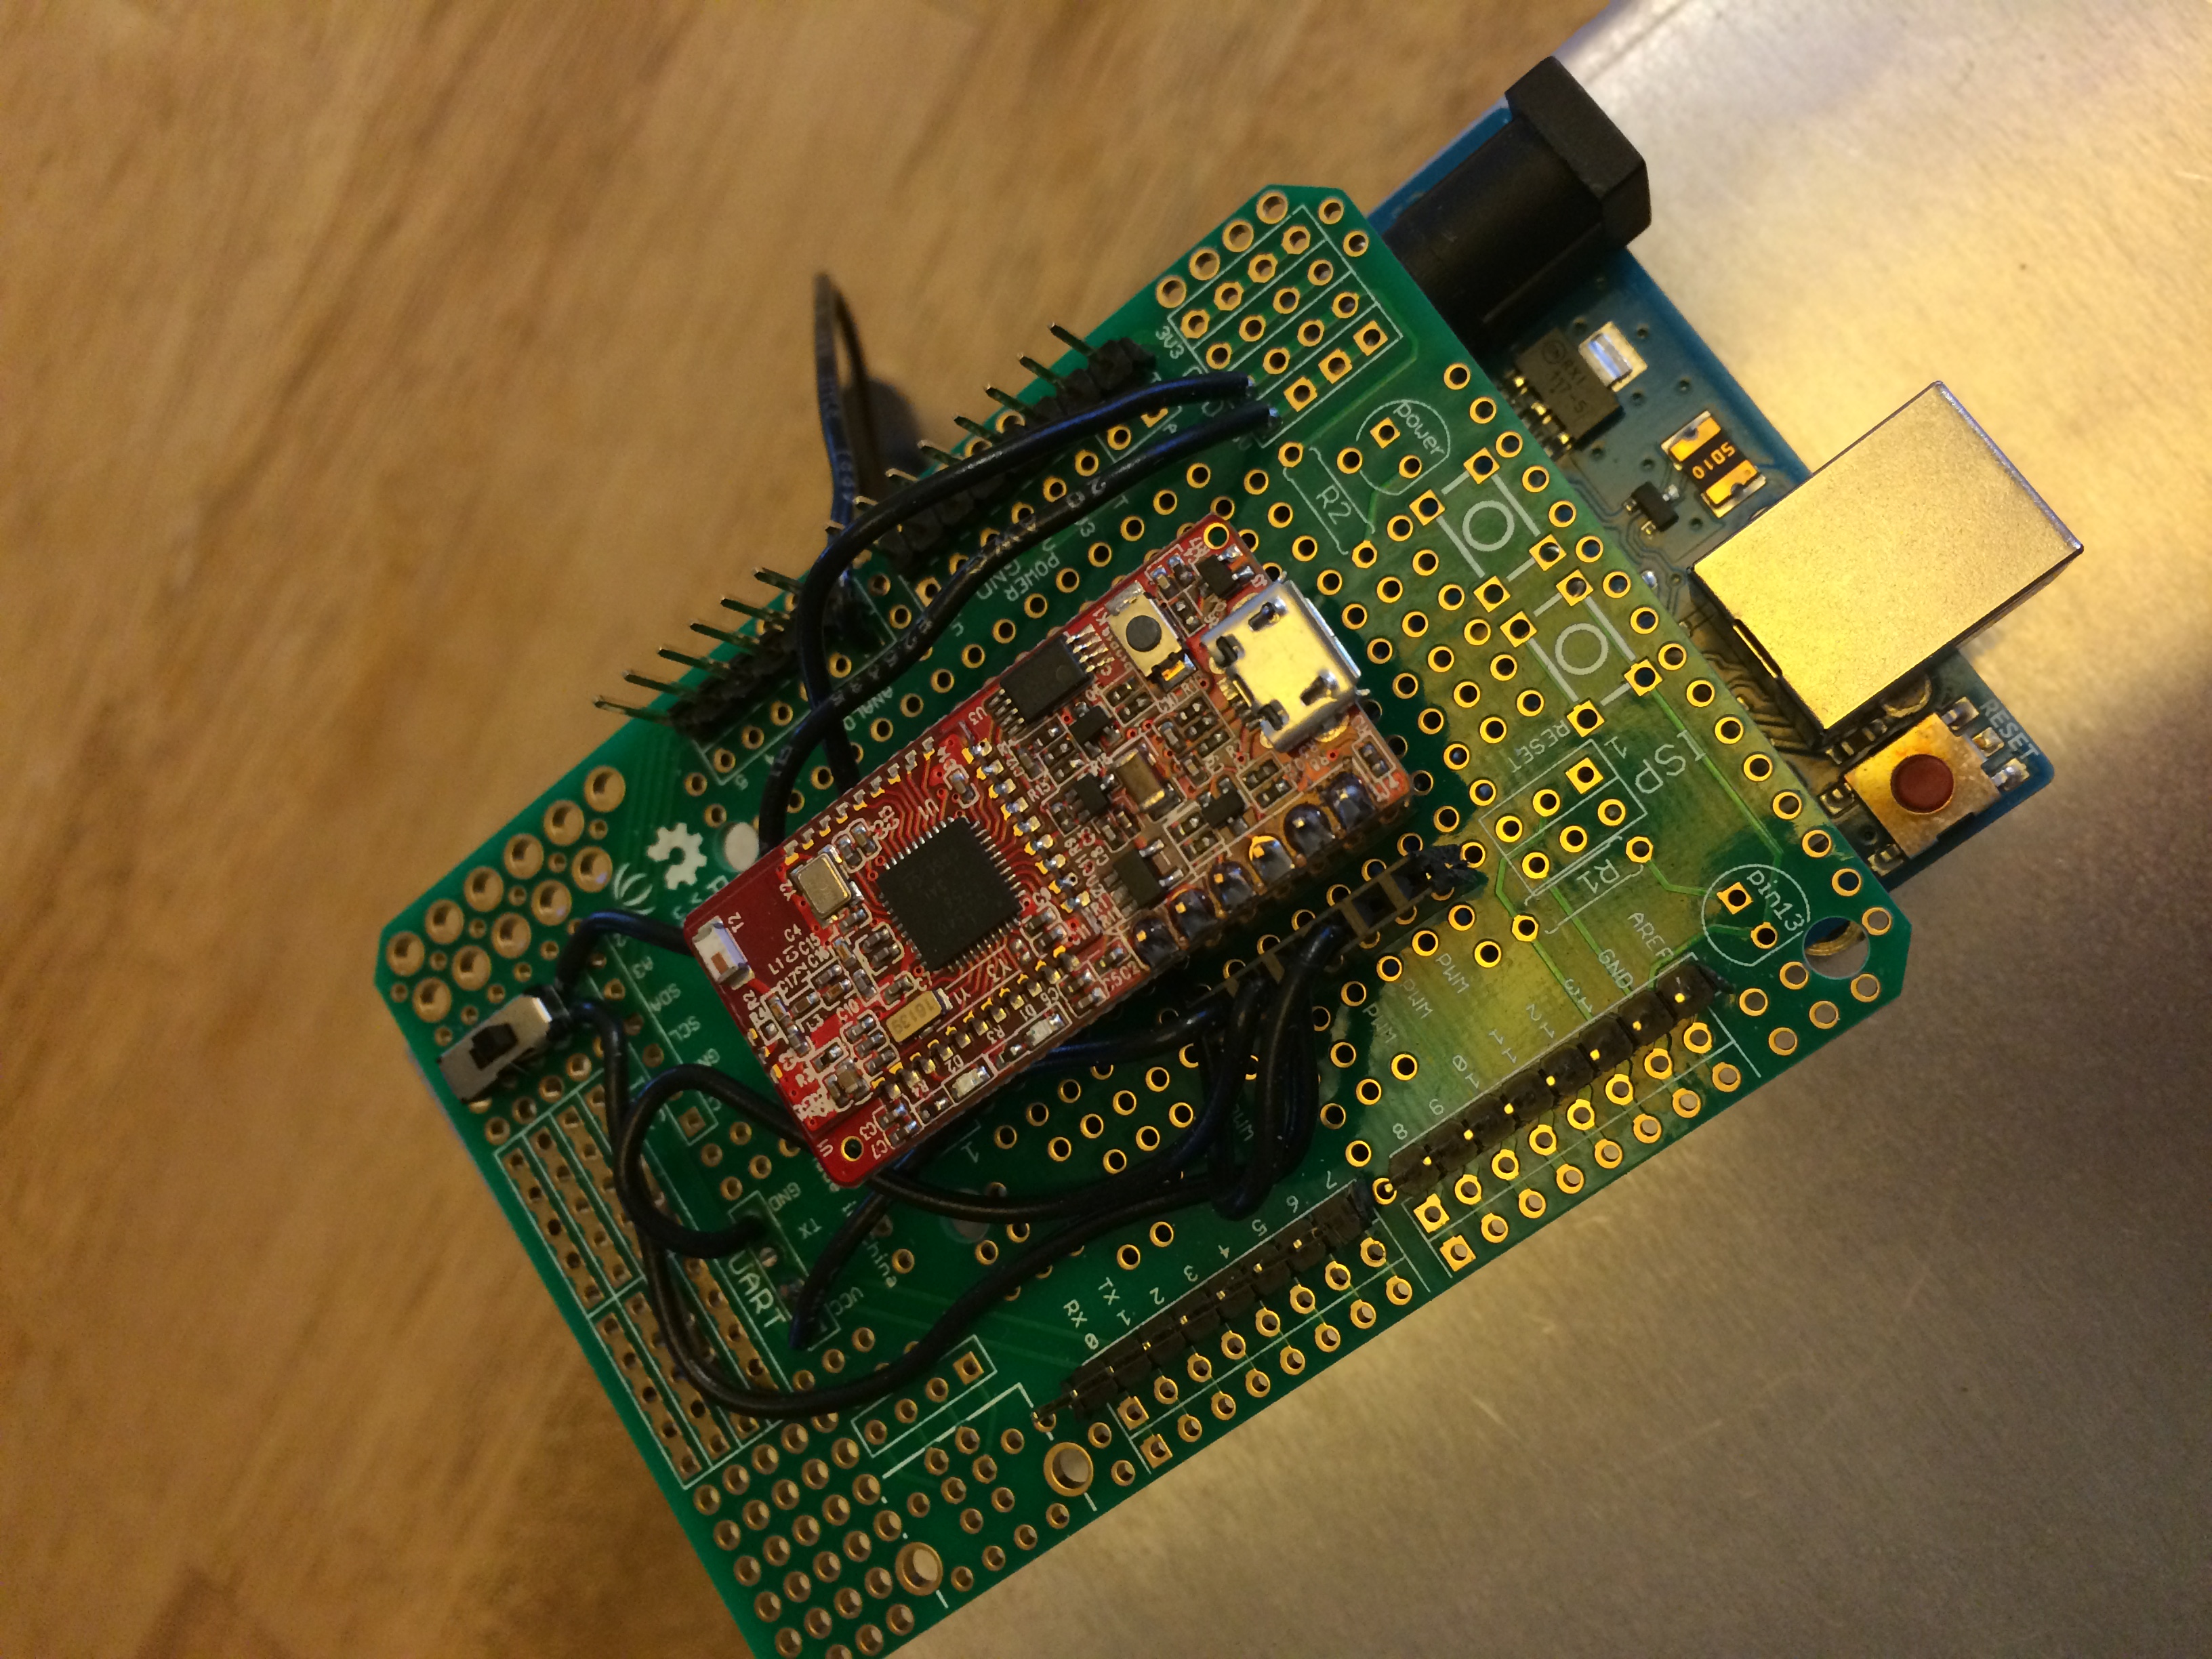
Arduino Uno with Bluetooth daughterboard (red board on top).
Note that the board is mounted outside the front-end shield. This is intentional. First, the Arduino is not nearly as sensitive to noise and does not need shielding. Second, digital electronics actually generates lots of noise and would interfere with the front-end board, so it needs to be outside the shield. Third, it is convenient.
Basically, we feed the analog wave signal into one of the Arduino’s analog-to-digital converters. An A/D converter, as it is called, takes the amplitude of a signal and converts it to a number. For instance, 0 volts will translate to the number 0, and 5 volts will translate to 255. A level of 2 volts would translate to 102. This translation happens in a fraction of a second, a “sample” is saved and another translation is done. This time interval is called a “sample rate.” If the sample rate is fast enough, we can get a good representation of a rapidly changing input signal as a series of numbers.
We then package these numbers and push them out to our radio transmitter, see below.
The Bluetooth Low Energy Board: This is a Bluetooth transceiver prototype board that conveniently plugs into an Ardunio prototype shield board. This is a little radio that allows us to connect to and transmit data to another device like a tablet computer. This board contains its own processor and firmware and automatically handles the Bluetooth protocol on the device side. We send data packets from the Arduino to the Bluetooth board, which then packages and transmits the data wirelessly to our tablet, described below.
Android Tablet Computer: I used a Samsung Galaxy S5 mini-tablet computer because I had one available. I developed a prototype Arduino application that connects to my front-end device using the Bluetooth protocol available in the device. I can display the bioelectric wave, the power of frequency bands and a chart showing trends in the power, more about that below in the Android App section.
Android App Notes: As with the hardware, this is a prototype application and not a full working version as you might expect with a commercial product.
What it does: Connects to and captures data packets from the front-end via Bluetooth, and displays this data in both wave and power form.
What it doesn’t do: There is no support for recording or uploading to a cloud server in this version.
The power display is used mainly for when EEG signals are being detected as these signals have been classified into various frequency bands Delta, Theta, Alpha, Beta and Gamma. The power display can be interpreted as how much of each of these bands is measured so the change in power is visible.
The power display is exactly like a sound equalizer display except that it is tuned to bioelectric signal frequencies rather than audio frequencies. This is accomplished by processing the wave data through an algorithm called a Fast Fourier Transform, or FFT.
Results: One of the more difficult aspects of this project was coming up with a low-cost design for the electrodes you attach to the skin to pick up the biosignals. I ended up making simple electrodes made of small steel washers. These worked quite well if you also use Ten20 conductive gel (quite cheap) and hold the electrodes in place on the skin with athletic tape.
I could easily detect heart and muscle activity. Detecting brainwaves was tricky, but I concluded this was due to the quality of the electrodes and not the electronics per se.
There is a demo Youtube video of the hardware being turned on but not actually connected to electrodes here. What you are seeing is a sequence of starting up the Android app, turning on the front-end electronics and then a display of various forms of the data being received. This demo does not have the electrodes connected so what you are seeing on the display is noise and the electronics settling. The top display is a representation of the wave (in this case noise) being sent from the Arduino via Bluetooth. The next display down shows the power spectrum from 0 to 60 hz. The third display down from the top is specific for an EEG setup: These are the power levels of the types of EEG signals Delta, Theta, Alpha, Beta and Gamma waves. The final display is a long-term trend graph of the power of the EEG signals.
The most impressive working demo is detecting a heartbeat as shown here. Muscle contractions associated with moving my fingers are demonstrated here, and an actual EEG signal (measuring my brainwaves) is shown here. For each of these demos, I simply changed the location of the electrodes on my skin.
Though the front-end box is quite large for something intended to be wearable, keep in mind this is a prototype to prove the concept. An actual product would be much smaller, just a few square inches in size.
There is great potential in turning this into a product, but my main interest was to put these various technologies together and having fun building both hardware and software to make a new device.
Posted in Electronics and Radios by Mark with comments disabled.